Relative Valuation Supports Small and Mid Cap Stocks
September 26, 2023
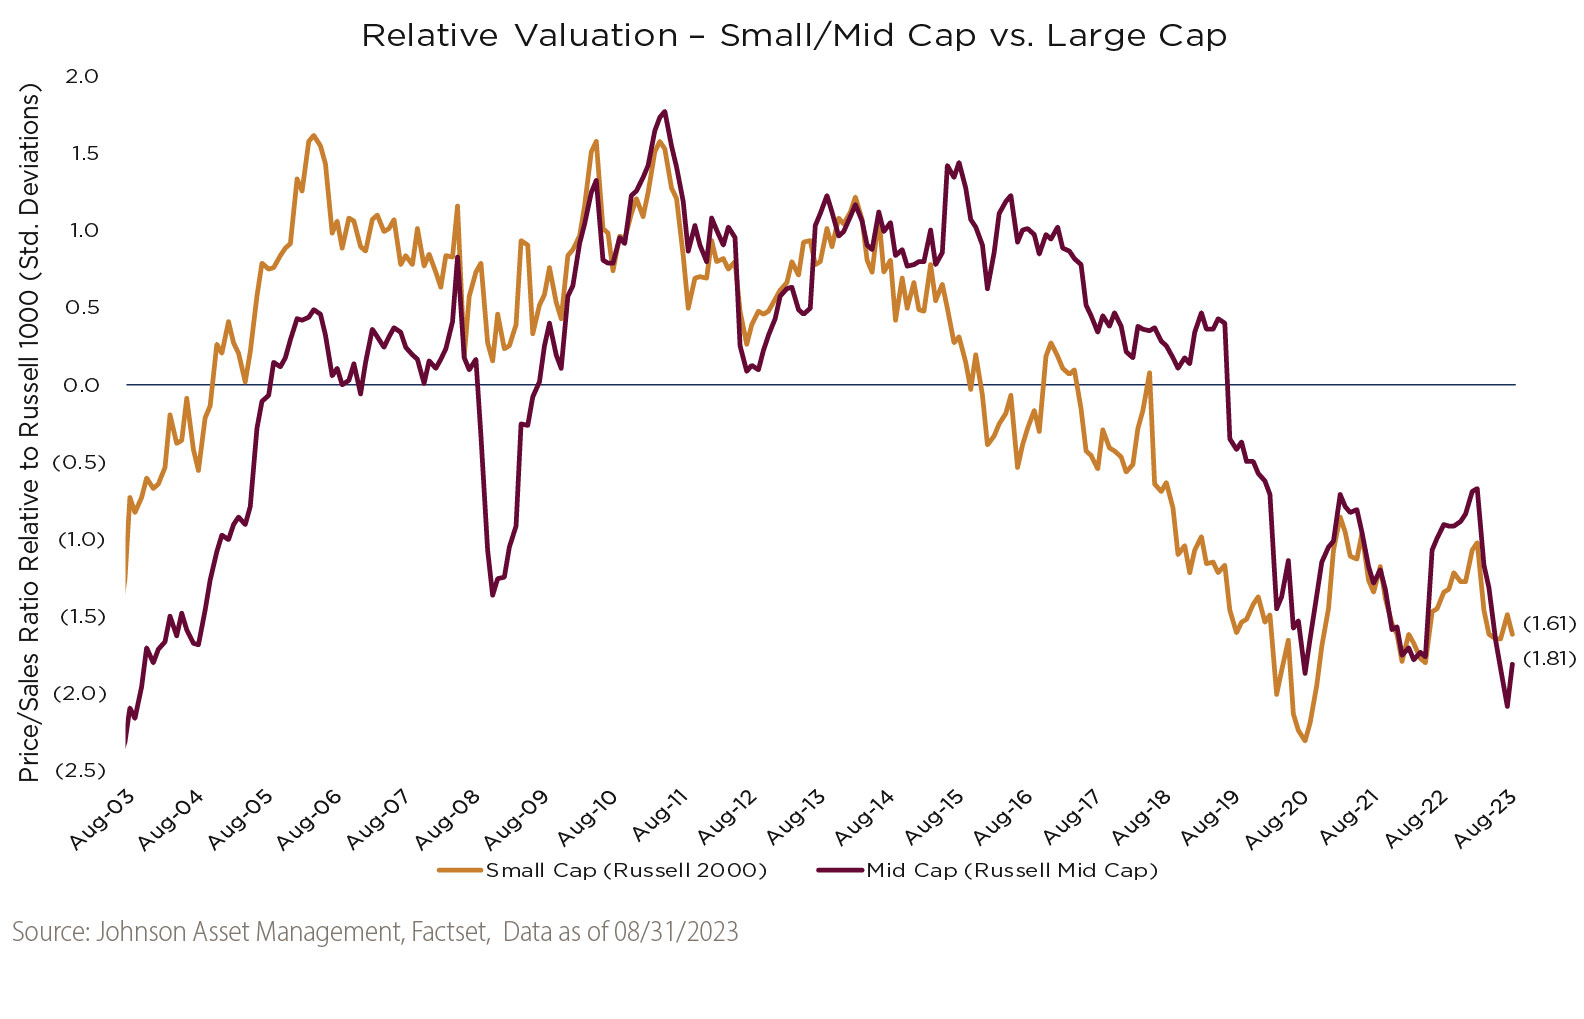
Asset allocation decisions are often relative, requiring tools for evaluation and comparison across investible asset classes. The chart above illustrates a simple framework to aid in considering equity market opportunities by comparing the relative valuation of small and mid cap stocks to large cap, using the price-to-sales ratio¹. By this measure, both small and mid cap stocks look attractive relative to large, trading more than 1.5 standard deviations below 20-year averages. Historically, these levels of valuation discount have offered support for positive relative performance going forward. For more information, see www.johnsonasset.com/resources.
¹ Why do we use the price-to-sales ratio? As you move down in market cap, the number of unprofitable or negative earning companies increases. The presence of these unprofitable companies creates the potential for distortions in broad-based comparisons using the price-to-earnings ratio. As a result, for a pure valuation comparison across market cap ranges, we prefer to use the price-to-sales ratio. However, by either metric, small and mid cap stocks look attractive relative to large cap.